
Macro Research10 March 2026
Welcome to Anchor Capital
Help us tailor your experience.

The global economy showed surprising resilience in 2025, but underlying issues are now emerging as we head into 2026. Rising protectionism, geopolitical fragmentation, and loose fiscal policies are creating a more fragile global economic environment.
ECONOMICS
The global economy surprised to the upside in 2025, demonstrating unexpected resilience in the face of tariff shocks, elevated geopolitical tensions and heightened policy uncertainty. Growth held up better than feared amongst tariff increases, with companies front-loading spending and investment, and inventory management strategies helping delay cost pass-through to consumers. These dynamics, combined with strong equity markets, robust corporate earnings and a powerful technology-led capital expenditure cycle, provided a meaningful cushion to global activity. A weaker US dollar also played an important role. As global risk appetite improved, capital rotated away from traditional safe havens such as US Treasuries towards higher-yielding opportunities, particularly in EMs. This easing in global financial conditions reduced imported inflation pressures across much of the developing world and enabled continued monetary policy easing in many jurisdictions.
However, as the global economy heads into 2026, underlying fault lines are becoming more visible. Rising protectionism, deepening geoeconomic fragmentation and persistently loose fiscal policy are creating a more fragile global backdrop. While the near-term growth outlook remains broadly constructive, the risk of policy-induced volatility has increased meaningfully.
China outperformed expectations in 2025 but enters 2026 constrained by entrenched structural challenges. Ongoing trade tensions, weak domestic demand, a shrinking labour force and a prolonged property sector downturn continue to weigh on the outlook. Efforts to curb excess capacity through China’s so-called involution process (characterised by increasingly intense and self-defeating competition among domestic companies for limited resources and opportunities) are likely to sustain deflationary pressures. That said, the central government’s strategic emphasis on technology self-reliance and manufacturing competitiveness, as articulated in its five-year plan to 2030, presents upside risks over the medium term.
In the eurozone, growth is likely to slow modestly in 2026 before improving thereafter. Rising real wages, employment gains, easier financing conditions and a material increase in defence and infrastructure spending (particularly in Germany) should support activity. Nevertheless, higher US tariffs on eurozone exports and intensifying competition from China remain a drag on manufacturing.
Inflation, affordability concerns and policy uncertainty increasingly dominate the US economic outlook. To date, the inflationary impact of tariffs has been relatively muted, aided by stockpiling, tariff pauses and trade diversion. However, upward pressure is emerging in core goods prices, raising the risk of greater pass-through in 2026. The US Fed’s policy path will therefore be pivotal. Our base case is for cautious monetary easing as the Fed balances cooling growth against lingering inflation risks. Leadership uncertainty adds a further layer of complexity, with Fed Chair Jerome Powell’s term ending in May 2026 and markets closely watching whether his successor adopts a more dovish stance aligned with the Trump administration’s preferences. Trade and tariff policy remains a central swing factor. While effective US tariffs have settled well below previously threatened levels, they remain materially higher than a year ago, weighing on global trade and investment. Legal challenges may constrain executive power, but alternative policy mechanisms suggest uncertainty will persist.
Against this complex global backdrop, SA is relatively well-positioned. Periods of improving global risk appetite typically see capital rotate out of the US and into higher-yielding EM assets, weakening the US dollar and supporting currencies such as the rand. This dynamic has been clearly evident, with rand strength proving highly beneficial for SA’s inflation outlook by easing pressure on fuel, food and imported goods. A firmer currency is also helping anchor inflation expectations, reinforcing the credibility of the South African Reserve Bank’s (SARB) newly adopted 3% inflation target.
Interest rate dynamics further support the outlook. Whilst the US has delivered 175 bpts of easing in the current cycle, SA, in comparison, has cut rates by only 150 bpts. This widening interest rate differential has supported rand strength, improved foreign appetite for domestic bonds and reinforced capital inflows. Importantly, markets are pricing in only one additional 25-bp cut with conviction this year, with a second only partially priced — reflecting policy credibility rather than constraint.
Moreover, this favourable external environment has coincided with meaningful domestic progress. Encouragingly, structural reform is beginning to show up in the data. SA has exited the Financial Action Task Force (FATF) grey list, secured a sovereign credit rating upgrade (with S&P Global upgrading SA’s foreign-currency sovereign rating to BB from BB- in November, while maintaining a positive outlook), and achieved measurable improvements in port and rail performance. New private-sector rail investment and additional fiscal revenues from online betting taxes further bolster the outlook.
Nonetheless, risks remain. Political uncertainty, including ANC succession dynamics and municipal election outcomes, could undermine confidence if poorly managed. SA also remains exposed to global commodity and rate cycles, with further work needed to build a more idiosyncratic investment case. That said, in a world characterised by higher geopolitical tension, weaker global institutions and rising fiscal dominance, SA is unusually well positioned. Global capital rotation, a weaker US dollar, supportive commodity dynamics and improving domestic credibility have combined to create one of the most constructive backdrops for the local economy in over a decade- provided recent gains are safeguarded through continued policy discipline and reform execution.
JSE-listed equities delivered an exceptionallystrong outcome in 2025. As measured by theFTSE/JSE Capped SWIX, SA equities delivered an impressive 43.5% return. Going forward, we will reference the FTSE/JSE Capped All Share Index (Capped ALSI) following the JSE’s Index Harmonisation project, which aligns the traditional All Share and SWIX indices.
SA equities’ remarkable return was achieveddespite a volatile global backdrop characterised by elevated interest rates for much of the year, persistent geopolitical uncertainty, and uneven global economic growth. Returns, however, were highly concentrated, with the top 20 stocks (out of c. 135 shares) accounting for 90% of the index’s total return. This marked a notable shift from 2024, when market leadership was broader and more diversified.
Looking ahead, we forecast a total return of 12% for JSE-listed equities. That said, the index composition has shifted meaningfully, with precious metals (gold and platinum group metals [PGMs]) now accounting for more than one-quarter of the Capped ALSI – adding considerable forecast risk to our estimates.
The standout contributors in 2025 were gold and PGM producers, supported by strong commodity prices, supply constraints, and improving earnings momentum. These sectors played an outsized role in index-level returns, with precious metals accounting for approximately half of the index’s total return, reflecting both performance and their growing index weight.
The banking sector also delivered a solid performance, underpinned by strong earnings growth, resilient balance sheets, and improving sentiment towards SA’s macroeconomic outlook. While valuations re-rated higher, this was primarily supported by fundamentals rather than excessive optimism.
In contrast, consumer-facing sectors and domestically focused industrials experienced more mixed outcomes. Competitive pressures, uneven demand, and company-specific execution challenges limited earnings growth in many cases. As a result, performance dispersion across the market was elevated, underscoring the importance of selectivity at both a sector and stock level.
Looking beyond the most recent year, the FTSE/JSE Capped SWIX has demonstrated notable resilience over the past five years with an annualised return of 19% p.a. (137% in aggregate), despite SA facing a prolonged period of weak economic growth, infrastructure constraints, and policy uncertainty. Even when measured in US dollar terms, the 5-year return is an impressive 16% p.a. compound return (relative to global equities, as measured by the MSCI World Index at a 13% return). This resilience reflects several structural features of the SA equity market, including:
Meaningful commodity exposure, providing diversification and a hedge during periods of global stress. Significant offshore earnings exposure, reducing reliance on local economic growth. Recent improvement in domestic risk sentiment and growth expectations. Generally strong balance sheets and disciplined capital allocation among large, listed companies.
Importantly, domestic equity returns over this period have not simply mirrored domestic economic conditions. Rather, the market has continued to reward globally competitive businesses and companies able to execute well in a challenging operating environment.
Looking ahead, we expect volatility to remain elevated by mere virtue of the fact that inherently volatile sectors such as gold and PGMs now make up more than one-quarter of the Capped All Share Index. This increases the sensitivity of market returns to commodity prices, currency movements, and global risk sentiment. As a result, while our forward-looking return expectation remains at around 12%, the range of potential outcomes is wide, making precise forecasts more challenging.
Resources: Earnings momentum remains strong, particularly in PGMs, supported by favourable supply dynamics and medium-term demand trends. While price volatility is likely to persist, the fundamental backdrop remains supportive. Domestic assets: These now comprise less than half of the index. Within this segment, valuations appear reasonable, especially following the approximately 200-bpt reduction in SA’s risk-free rate over the past year. We expect the local banking sector to continue delivering solid earnings growth. Although valuations have rerated higher, they do not appear stretched relative to history or to global peers. Retailers and the consumer: The outlook remains mixed. While there are pockets of strength where certain companies are executing well and gaining market share, broader SA consumer data remains inconsistent. High competitive intensity and execution challenges remain a key risk, making it difficult to form a high-conviction view at a sector level.
Encouragingly, SA’s reform narrative is gaining traction, with incremental improvements in energy availability, logistics, and governance contributing to improved confidence at the margin. While progress remains uneven and at times frustratingly slow, the direction of travel is positive.
Tencent, and by extension Naspers and Prosus, continues to look attractively valued relative to its long-term growth prospects and strategic positioning. Tencent remains one of the best-positioned companies in the global internet landscape, with strong franchises across gaming, social platforms, digital payments, and ecosystem monetisation. We remain constructive on Tencent’s outlook into 2026 and view exposure via Naspers and Prosus as an attractive way to access global growth at a meaningful valuation discount.
In summary, 2025 was a strong but highly concentrated year for South African equities. While the market delivered solid returns, outcomes were driven by a narrow group of sectors, reinforcing the importance of diversification and selectivity. Looking ahead to 2026, volatility is likely to remain a defining feature. Nevertheless, opportunities persist across resources, banks, selected domestic assets, and global growth exposure via Tencent, Naspers and Prosus. We remain focused on navigating this environment with a disciplined, selective approach, anchored in our core philosophy of underpinning our portfolios with quality companies we believe will compound over time.
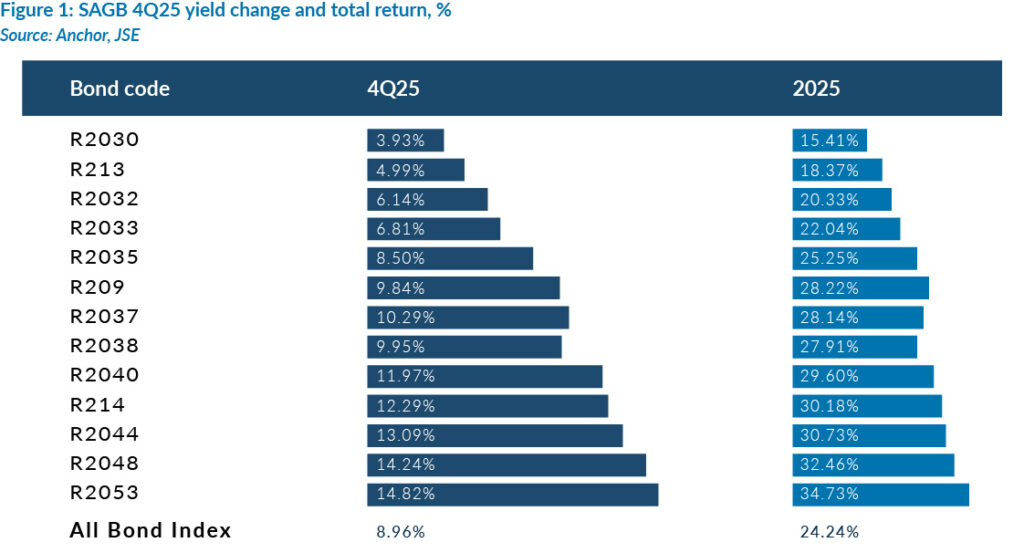
The South African Government Bond (SAGB) yield curve bull-flattened during 4Q25, with longer-dated yields declining more sharply than those at the front end. As a result, the SA All-Bond Index (ALBI) delivered a strong 4Q25 return of 8.96%, bringing its full-year performance to an exceptional 24.24% (Figure 1). The rally was driven primarily by a downward revision in inflation expectations and a reduction in government bond supply, developments that disproportionately benefitted higher-duration assets. Despite SAGB yields rallying by 200 bpts over the course of 2025, we remain cautiously optimistic on the asset class.
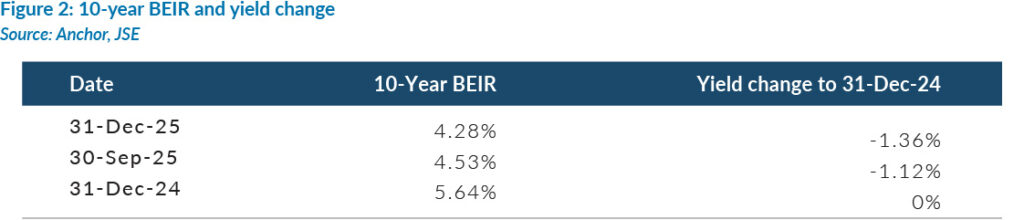
Market participants continued to recalibrate inflation expectations lower following guidance from both the National Treasury and the SARB, which reaffirmed their commitment to a lower inflation regime. At the 2025 Medium-Term Budget Policy Statement (MTBPS), the Minister of Finance Enoch Godongwana formally announced a reduction in the inflation target to 3%, with a one-percentage-point tolerance band (2%-4%), replacing the previous 3%-6% target range. Consistent with this repricing, the 10-year breakeven inflation rate (BEIR) – the market-implied average inflation rate over the next decade – ended 4Q25 at 4.28%, having narrowed by more than 100 bpts over the course of 2025 (Figure 2).
At the 2025 MTBPS, the finance minister also announced a reduction in government bond issuance. National Treasury lowered weekly nominal bond supply from R3.75bn to R3bn, signalling improved funding conditions and reduced borrowing requirements, alleviating pressure on the bond market and reinforcing confidence in the fiscal trajectory.
We identified this inflexion point as early as 2Q25 and began positioning our local fixed-income portfolios for a bull-flattening environment. This positioning proved highly effective, contributing meaningfully to our performance in 2H25.
Despite SAGB yields having rallied by approximately 200 bpts over the course of 2025, we remain cautiously constructive on the asset class, as attractive relative-value opportunities persist. SA’s macroeconomic backdrop continues to improve, reflecting both cyclical recovery and structural reform. Fiscal dynamics have strengthened meaningfully – one of the key factors behind SA’s credit rating uplift by S&P Global last year. The primary balance has moved into surplus, and the overall fiscal deficit continues to narrow. As government bond yields decline, interest costs as a share of tax revenue are set to fall, reinforcing a positive feedback loop between fiscal sustainability and borrowing costs.
The inflation outlook has improved, supported by stable oil prices, a firmer rand and a restrictive real policy rate. At the same time, growth indicators are turning more constructive. Corporate loan growth has accelerated sharply – historically a reliable leading indicator of rising capital expenditure – while the share of corporate credit in total bank lending has increased, both pointing to a recovery in business confidence. Higher infrastructure spending should further support employment growth, thereby broadening the tax base.
Structural constraints on growth are also easing. Energy availability has improved markedly, with loadshedding largely eliminated, while logistics bottlenecks are gradually unwinding as rail and port volumes recover. Together, these developments suggest that long-standing constraints on SA’s growth potential are being alleviated as energy and supply-chain reforms gain traction.
External resilience has strengthened materially. Foreign exchange reserves have risen to record highs after more than a decade of stagnation, while terms of trade remain highly favourable and are likely to stay so. Elevated terms of trade should support a return to surplus for the current account balance, reducing a key external vulnerability.
Taken together, these developments indicate that the strong performance of domestic bonds (and other local asset classes) reflects both cyclical improvement and a compression of structural risk premia. Our models continue to favour long-dated SAGBs, with a particular preference for the 15–20-year segment of the curve. Despite the decline in absolute yields, the SAGB curve remains relatively steep, creating compelling relative value opportunities. Several yield differentials remain close to +2 standard deviations above their long-term averages, while the 15–20-year segment offers the most attractive rolldown, reflecting the pronounced hump in the zero-coupon curve. The combination of an improving macroeconomic environment, residual value and superior roll dynamics continues to support our constructive positioning in this part of the curve.
SA government bonds continue to offer some of the highest yields in the EM universe. These elevated yields, however, still embed a meaningful fiscal risk premium, reflecting ongoing concerns around SA’s debt trajectory and fiscal policy credibility. Against this backdrop, we estimate that domestic bonds could deliver returns of approximately 9% over the next 12 months, implying a real return of around 6%.
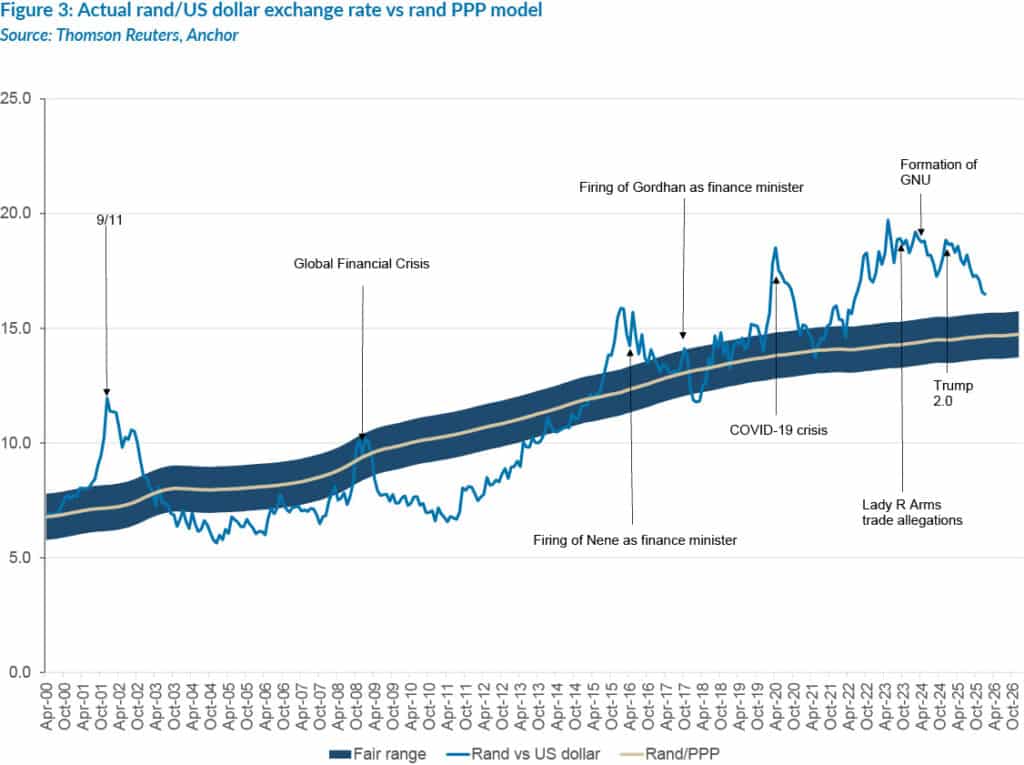
Anchor subscribes to a purchasing power parity (PPP) model for the long-term value of the rand. Over the past three years, this model has shown the rand as meaningfully cheap against the US dollar, as is evident from Figure 3 below. This undervaluation against the US dollar reflected a combination of an exceptionally strong US dollar and a series of own goals by SA. Our modelled fair value of the rand is in the R13.73-R15.73/US$1 range.
As shown in the graph below, the rand has been recovering from its oversold levels and is rapidly approaching our fair-value range. With the rand no longer deeply undervalued, investors are increasingly questioning whether further strength is likely.
If we look at the reasons for the rand’s recovery, it has been primarily driven by a weaker US dollar. The US Dollar Index, which tracks the value of the greenback against a basket of six major global currencies, declined by 9.4% in 2025. Despite this correction, we believe that the US dollar is still strong relative to its underlying fundamentals, and most analysts are talking about some modest US dollar weakness in 2026. At Anchor, we believe that this weakness will more likely be toward the second half of the year, particularly if the US Fed eases monetary policy more aggressively than currently anticipated.
Domestic factors also remain supportive. Lower oil import costs and rising export prices for gold and platinum continue to improve SA’s terms of trade. This provides a supportive backdrop for the rand. In addition, locally, we are seeing improving fundamentals as investments in infrastructure are likely to accelerate and support growth. Stronger growth dynamics are likely to bolster employment and, in our view, contribute to tax revenues exceeding forecasts, potentially resulting in some positive surprises for the National Treasury on this front.
So, overall, we think that the factors supporting rand strength will remain intact and that the path of least resistance is for the currency to keep recovering. We are pencilling in an exchange rate forecast of R16.00/US$1 at the end of 2026, reflecting our view of modest gains.
As mentioned in The Navigator: Anchor’s Strategy and Asset Allocation, 4Q25, dated 18 October 2025, SA’s shift toward a 3% inflation target will likely reduce the volatility and rate of depreciation of the rand. This narrowing of the gap between SA’s inflation target and that of the US means that the rand should, over time, only depreciate by, on average, 1% p.a. This is a meaningful structural change for the outlook of the local unit.
We note that the currency is now closer to its fair value. This means that its ability to appreciate rapidly is more limited, particularly given that we also think that the strength will be more prevalent in 2H26. The rand being closer to fair value also means that it is more susceptible to adverse shocks. These are impossible to anticipate, but one should be aware that with Trump’s foreign policies and SA’s 2026 Local Government Elections later this year, any number of factors might surprise, and the impact could be more pronounced than it has been in recent years.
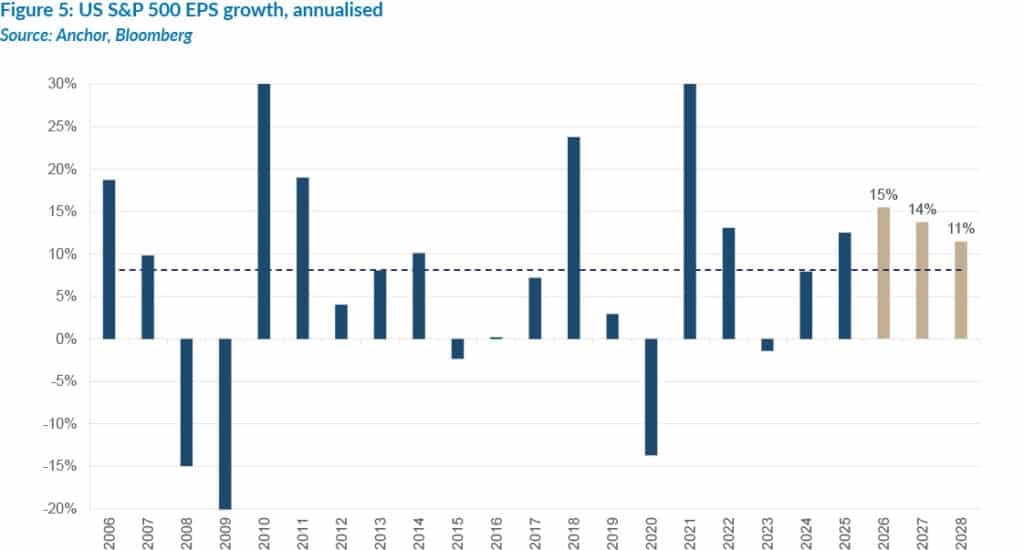
We expect the equity bull market to extend into 2026, following three consecutive years of positive returns. This has been driven by robust earnings growth (particularly in the US), with consensus forecasts indicating compound annual EPS growth of 12% for the next three years. Given this very strong growth momentum, it is no surprise that equity markets are trading at near record-high valuations. Our base-case expectation is for an equity market return of 8% in 2026, based on earnings growth of 15% and some derating.
When markets have built in high expectations, disappointments or surprises can be costly, and there is every prospect of a 10%-15% correction at some point during the year as a realistic risk. However, when we look 12-24 months out, we continue to expect equity markets to trade higher. Driving our confidence is the generational shift in technology capability currently underway and the impact this will have on the US economy and global productivity.
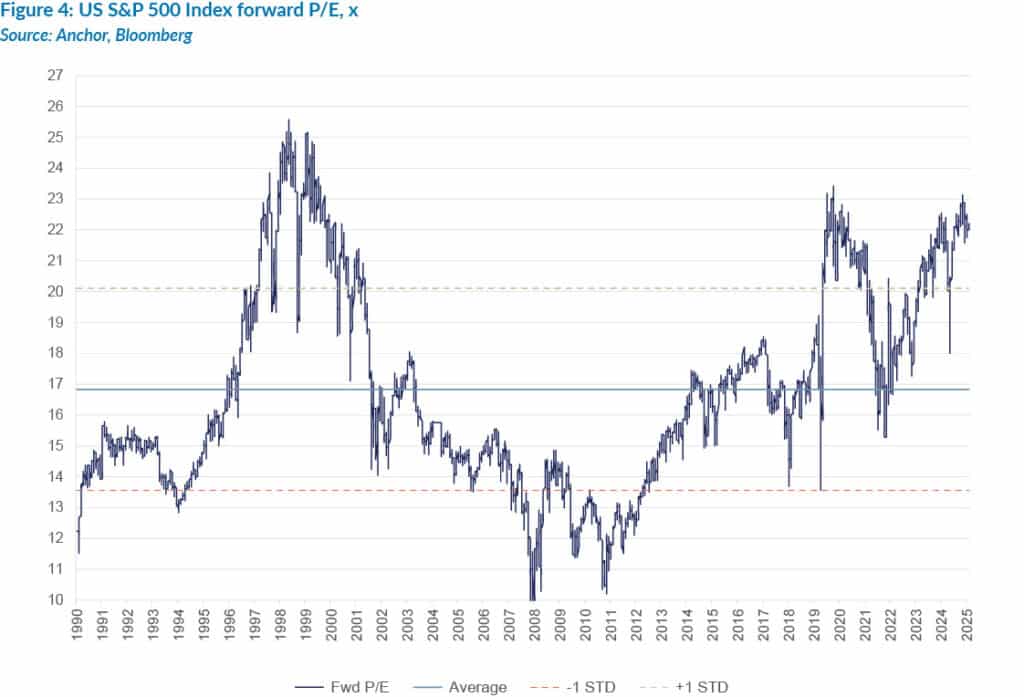
In 2025, the US equity market delivered a total return of 17%, comprising 12% from earnings growth and dividends, and 5% from valuation expansion. The forward 22x P/E for the S&P 500 shown below is well above the average of the past 20 years and close to a 20-year high.
It feels intuitively uncomfortable investing when valuation levels are high, but good returns can still be earned at high entry points if the underlying growth is strong. Market expectations reflect this dynamic (see Figure 5), with the S&P 500 EPS growth forecast at 15% in 2026, supported by lower interest rates, resilient GDP growth, and sustained, large-scale investment in AI.
Investment returns in 2025 have been dominated by the major AI players. Unprecedented capex spending on data centres, chips and energy is a major driver behind US GDP growth. Capex estimates for 2025 are in the region of US$450bn (and a running total of US$1.3trn on a trend that started about three years ago). This is expected to rise beyond US$600bn in 2026. The market capitalisation of the top 7 US tech companies (“Magnificent Seven” [Mag 7] – Apple, Amazon, Microsoft, Meta, Tesla, Nvidia and Alphabet [Google]) now exceeds one-third of the S&P 500 and 20% of global DMs.
Significantly, the current AI boom differs materially from the 2000s dot-com bubble. AI investment is highly capital-intensive and is dominated by enormous, cash-generative companies funding expansion from their own balance sheets, rather than leveraged startups (new companies incurring debt). Excluding Tesla, the Mag 7 companies trade at around forward 30x P/E multiples. This is not excessive given their potential growth rates, but the market will want to see a return on their massive investment spend. These companies have had to invest aggressively despite uncertainty around future business models, recognising that failing to adapt to structural technological changes can be a death knell.
The immediate impact of AI is being felt in the US economy across the board, from construction and other spending (e.g., Caterpillar’s share has risen sharply). Later in the decade, the more significant impact will come from technology-driven productivity gains. Some market pundits are predicting sustained 3%-plus US GDP growth in the latter years of the decade. But this will not be a smooth ride, and along the way, markets can lose patience, especially when valuations are high. In 2022, the aggregate value of the Mag 7 shares halved as scepticism around future growth increased, driven by Meta’s earnings and return disappointments. This was followed by three spectacular years for these shares.
All eyes will be on AI progress in the US and China (catching up quickly), but there is undoubtedly a lot else going on around the world (something of an understatement). The US has carried out strikes on numerous countries in the last year, notably Syria, Iraq, Iran, Yemen, Somalia, Nigeria and Venezuela. Geopolitical risks continue to rise, increasing the chances of allied retaliation, with China invading Taiwan a possibility. This could be devastating for US tech shares as Taiwan Semiconductor Manufacturing Company (TSMC – Taiwan’s biggest company) is a crucial part of the AI supply chain.
Beyond technology, broader US economic conditions remain solid (if somewhat mediocre), with recent jobs numbers indicating a slowing of momentum. This should lead to another 25-50 bps cuts in US interest rates in the next 6 months, with potentially more if Trump-induced pressure flows through to the new Fed chair. The much-anticipated inflation spike from “Trump tariffs”, which dominated headlines earlier last year, has not materialised. Imports account for less than 20% of US consumption, and the rise in import prices has been limited to about 5%. This lower figure – compared to the anticipated 15% – is due to factors such as tariff exclusions, finding import alternatives, absorbing margins, and evading tariffs.
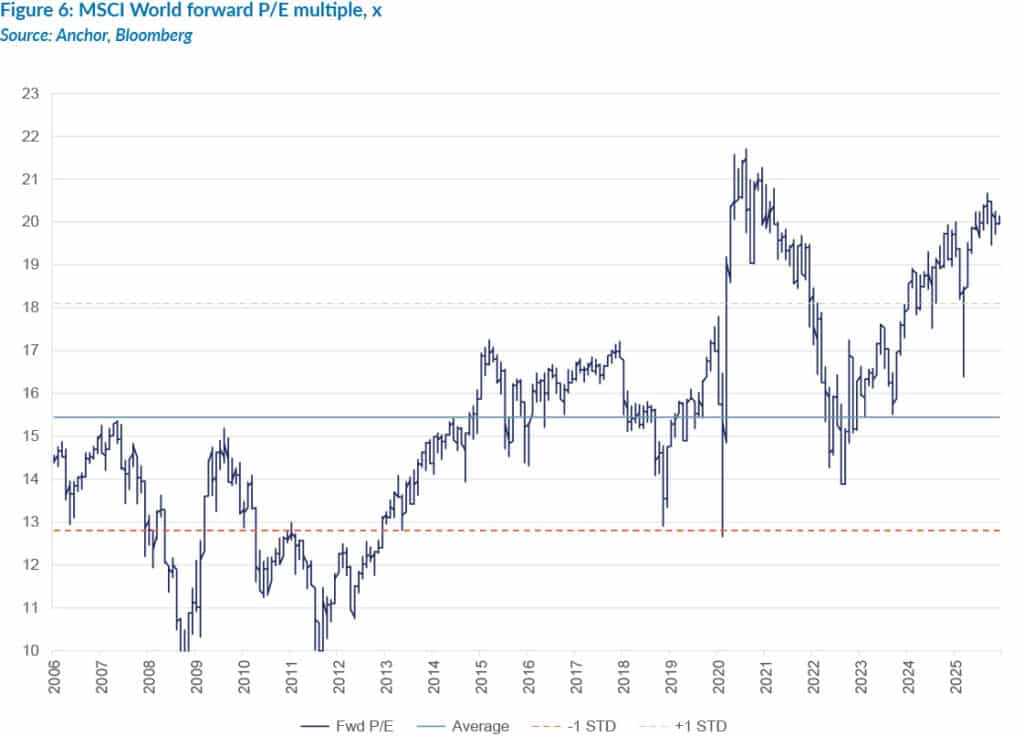
Outside the US, earnings growth prospects look less exciting, with one of the major drivers being massive increased defence spending in reaction to the Trump/Putin-induced environment of militancy. Non-US equity markets did exceptionally well in 2025, mainly due to valuation re-rating (as opposed to earnings growth) as investors looked for refuge from the tariff chaos in the US. The strong performance of non-US markets has seen aggregate global valuations reach historic highs. The chart below shows that the MSCI World forward P/E (20x) is not dramatically higher than the 22x in the US. We do not expect material outperformance from non-US shares in aggregate over the next 12-24 months.
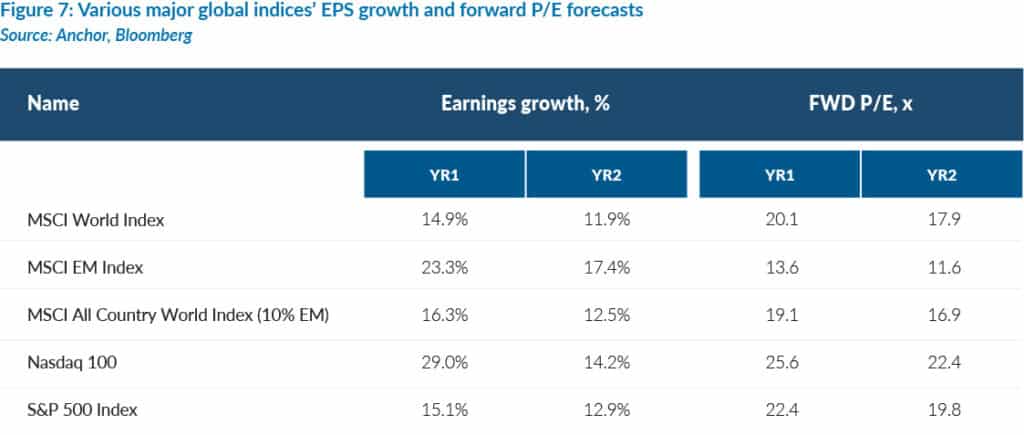
The table below shows the earnings growth and P/E multiples of the various world indices.
US interest rates enter 2026 with the US Fed facing a familiar dilemma. Inflation has eased meaningfully from its post-pandemic highs but remains above the Fed’s 2% target, while the labour market shows early signs of weakening. This tension has left policymakers balancing the need for further monetary easing against the risk of cutting too quickly and allowing inflation to re-accelerate.
Having already delivered 1.25% of cuts over the past year and a half, the Fed now appears ready to slow the pace of easing. We expect two further 0.25% cuts this year, taking the policy rate towards 3.0%. After being caught off guard by inflation once, the Fed is reluctant to repeat that experience, particularly given the continued resilience in broader economic activity. A new Fed chair will be appointed in 2026, introducing a degree of uncertainty, though not enough to alter policy direction meaningfully. The institutional framework and legal structure of the Fed remain anchored to its dual mandate of stable inflation and maximum employment, with a democratic process for setting rates, meaning that the Fed chair cannot act unilaterally.
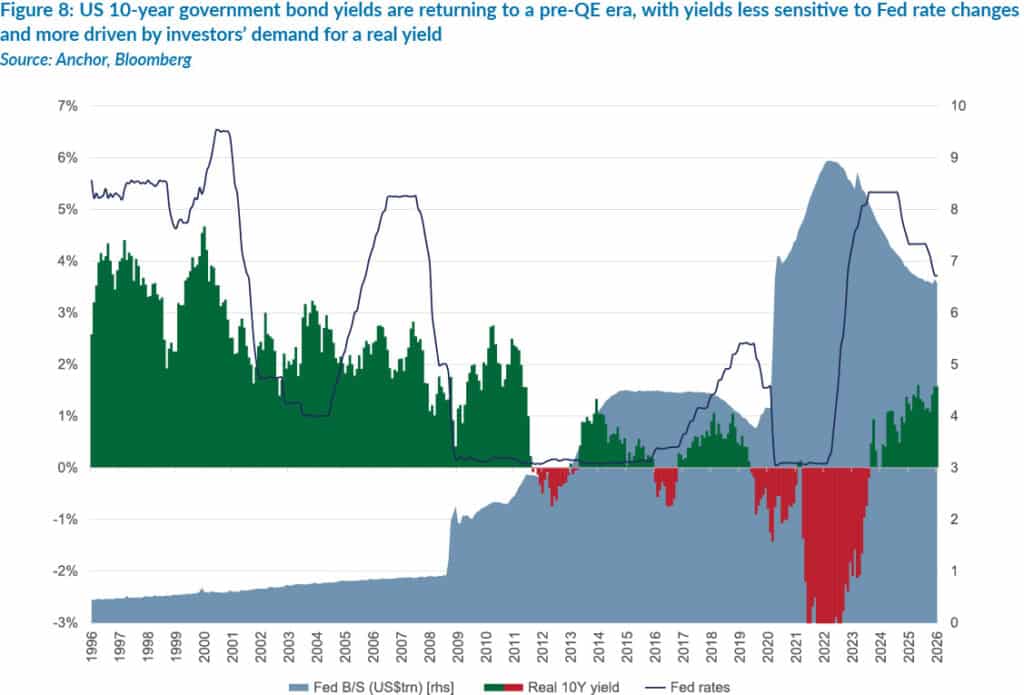
Despite additional Fed cuts expected this year, we do not anticipate a meaningful decline in US long-term yields. The 10-year US government bond yield currently trades near 4.2% p.a., and we expect it to remain close to that level over the next twelve months. Two forces are likely to keep yields anchored around current levels:
Markets have already incorporated expectations of a policy rate in the 3%–4% range over the medium term. As such, further cuts are unlikely to drive 10-year yields materially lower.
Originally published on anchorcapital.co.za. All views expressed are those of the author and do not constitute financial advice.